A while ago, Andrei published a post in which he uploaded and spoke about seven key charts that show plain and simple that global warming is real and man-made, unless you know of another perturbing climate factor other than humans capable of producing the same effects. Like I said, plain and simple – for those reasonable to listen. But don’t take our words for it, by all means be skeptical about it, in all seriousness. What I want to show you today, however, are a few more charts, this time from a different perspective.
Previously we showcased some charts that describe temperature anomalies and heat content disruptions, now I want to show you some figures that are less abstract, and more down to earth. These were made possible thanks to the due diligence of Henry David Thoreau, a Massachusetts from the mid-1800s who kept a strict and detailed record of flower and bird-migration times in the United States. Richard Primack, a conservation biologist working at Boston University, found Thoreau’s journals and put them to good use by comparing the data with what we know today.
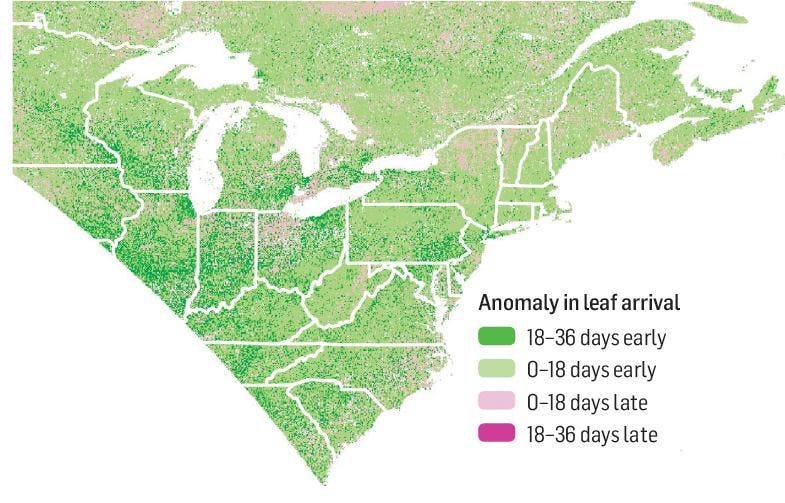
You didn’t need high technology back in Thoreau’s time to come up with valid figures – just a keen eye and a lot of patience. That doesn’t mean that nowadays we need to go through the same painstaking efforts to reach the same results. For instance, the image below was made using data from a satellite which measures levels of foliage. It tells us that in 2012, plants leafed out a full month early in some parts of the Northeast. To be more precise, highbush blueberry and pink lady’s slipper orchid flowered up to 4.1 days earlier for every degree Celsius rise in mean spring temperatures.
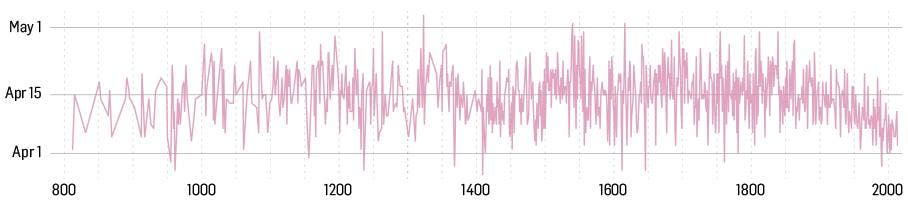
Next, similarly to Thoreau’s records, the Boston researchers made a comparative analysis of cherry-blossom records for Kyoto, Japan. There are more or less considerable variations throughout the millenia, still notice the sharp variance in the past 100 years, coinciding with mankind’s ever-growing dependence on fossil fuels.
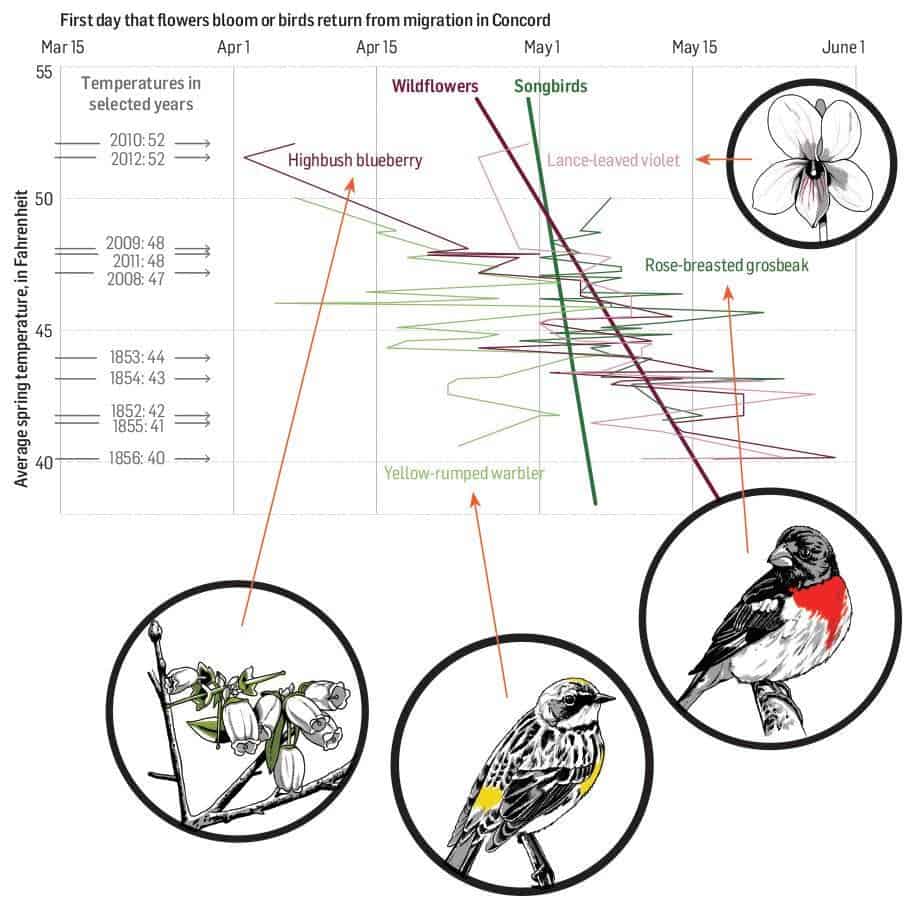
Back to Boston, wildflowers [pink] in the neighbouring town of Concord are apparently responding to spring temperatures faster than migratory birds do [green].
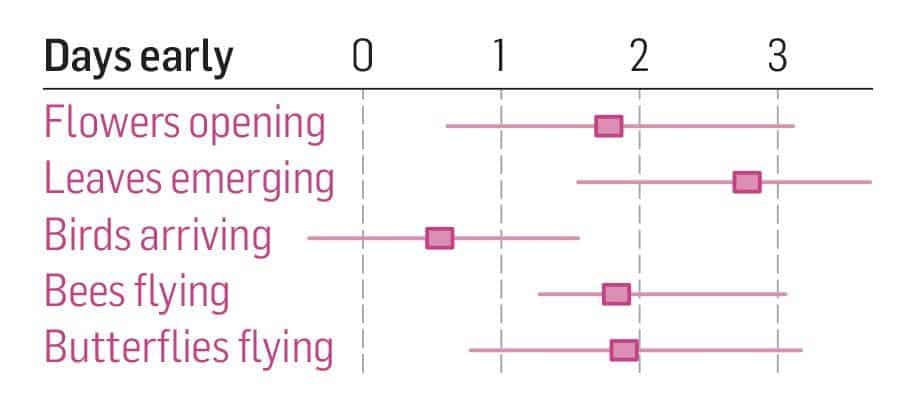
Also, insects seem to respond differently to warmer temperatures as well.
In all, wildflowers bloomed three weeks earlier in 2012 than in the mid 1800 during Thoreau’s time. Based on this trendline, the Boston researchers envision three possible scenarios for the future as shown in the graph where it forks.
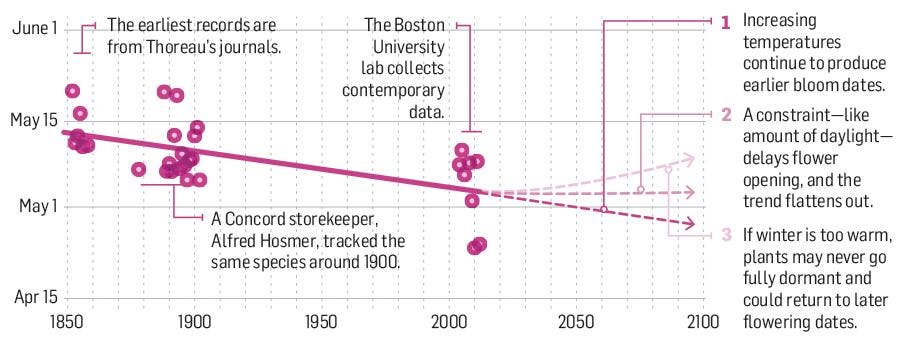
So, plants bloom earlier, way before the pollinating insects surface, while birds return from their migratory journeys too late to find sufficient bug meal. An ecosystem which used to be in harmony is now threatened by bad timing.
“Spring plant growth indicates the start of the growing season and will influence ecosystem processes such as nutrient cycling and carbon sequestration,” says postdoctoral researcher Elizabeth Ellwood. “Interactions with animals will also be affected as herbivores depend on spring plant growth and pollinators rely on open flowers. The timing of when plants and animals begin spring activity can be altered by temperature to varying degrees, and there is still much to understand about how temperature extremes will affect different organisms.”
These charts are, of course, relevant for the Boston area, yet if similar methods were to be applied in other regions, a similar pattern may likely be found. On a grander scale, it’s worth noting that other studies have shown that severe shifts in vegetation have occurred on a global scale due to anthropogenic warming. For instance, climatologists found green plants could move further north by as much as a whooping 20 degrees latitude by the turn of the century. What’s arid today may bloom tomorrow and vice-versa, only this will happen at a rate which is unnatural, living little room for adaptation.
[NOW READ] Just 90 companies are responsible for 60% of all man-made global warming
[story via PopSci]


