ZME Science
No Result
View All Result
ZME Science
No Result
View All Result
ZME Science

Home → Science → News

What are the average colors of the world? Data science offers a creative answer

Earth's color palette in a series of creative maps.

Tibi PuiubyTibi Puiu
July 16, 2021
in Great Pics, News
A A
Share on FacebookShare on TwitterSubmit to Reddit

RelatedPosts

People Who Blocked Their Smartphone’s Internet for Two Weeks Report Big Mood Boost
Japanese metallic tail can help keep the elderly upright
120-year-old condom found in Japan — and the company that made it still makes condoms
No green thumb required: Open-source robots can now grow a small farm for you

In 1972, the Apollo 17 crew snapped one of the most famous photos ever taken, showing the Earth in all its glory for the first time in human history. The image has remained in the public consciousness as the ‘Blue Marble’ since it resembles the spherical agates we used to play with as children. Indeed, more than 70% of Earth’s surface is covered by oceans, reflecting a beautiful blue color.

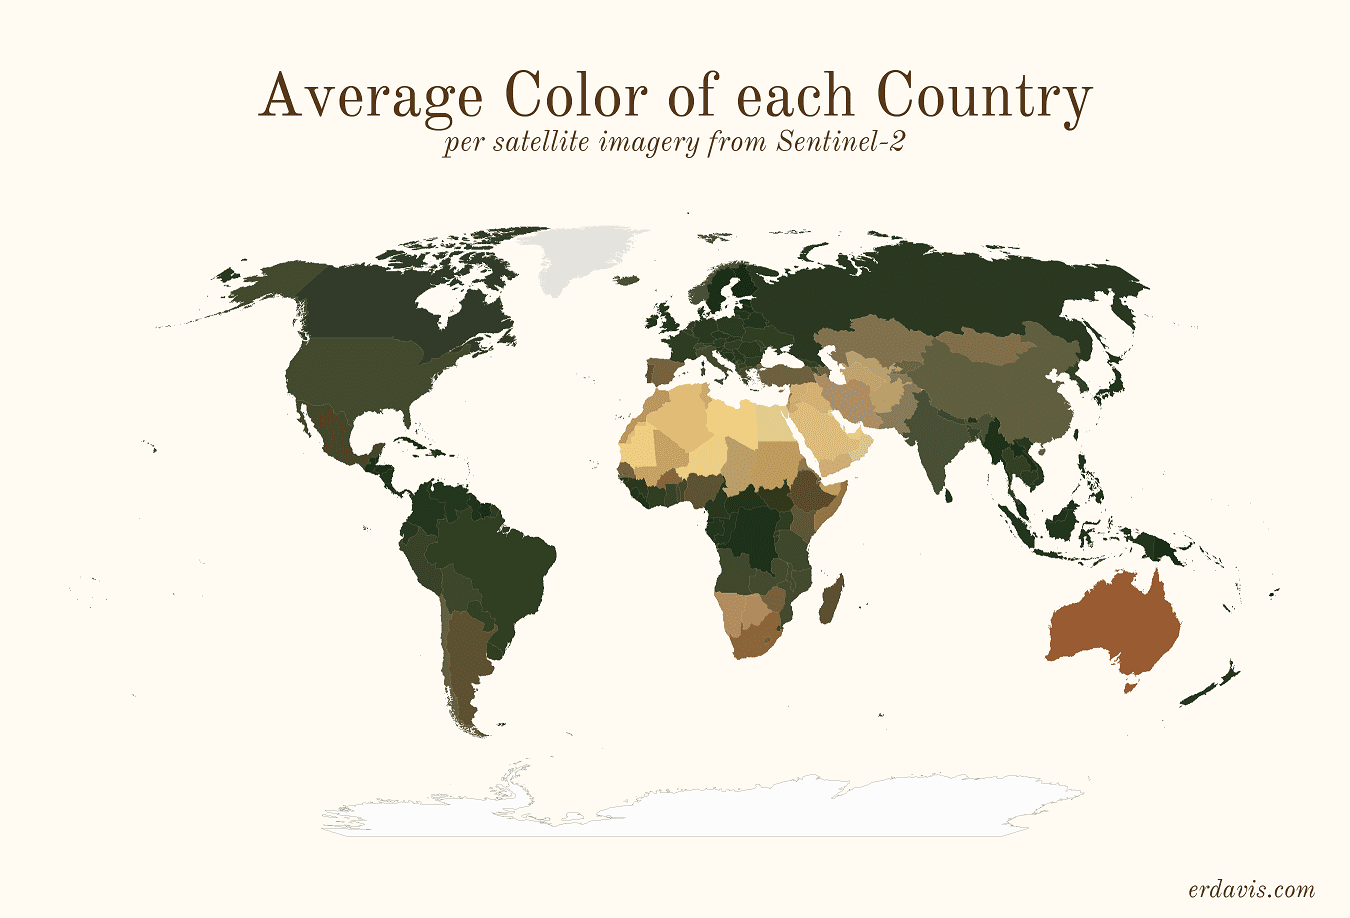
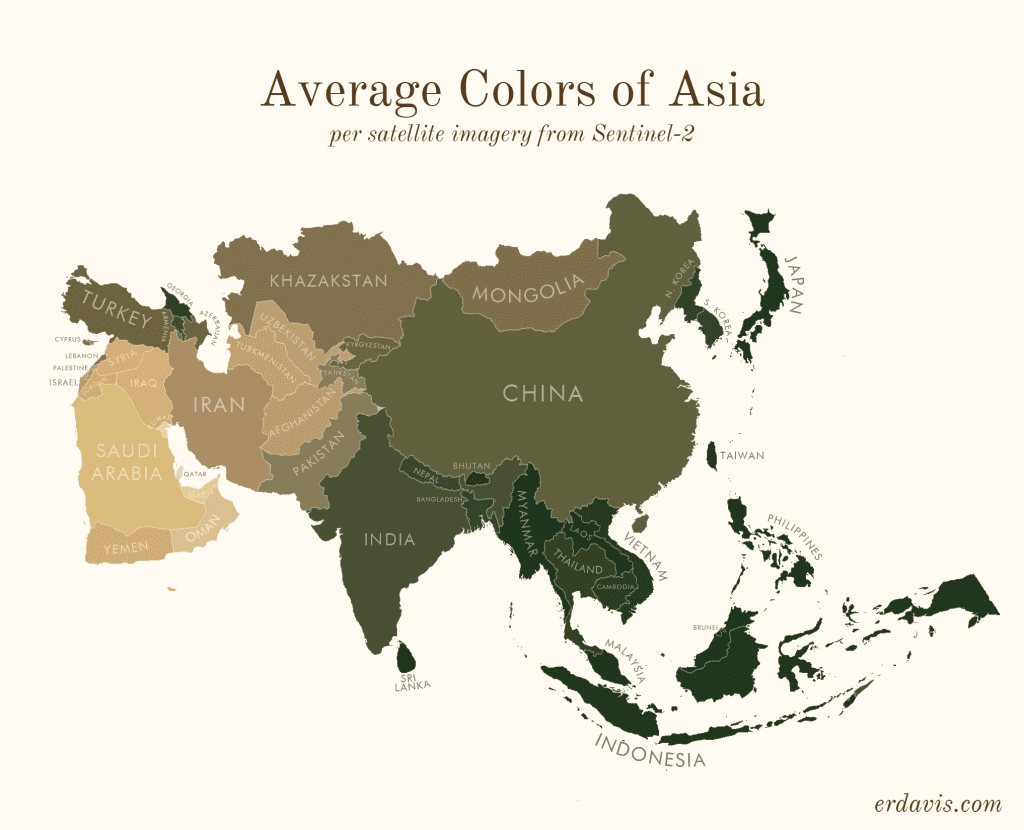
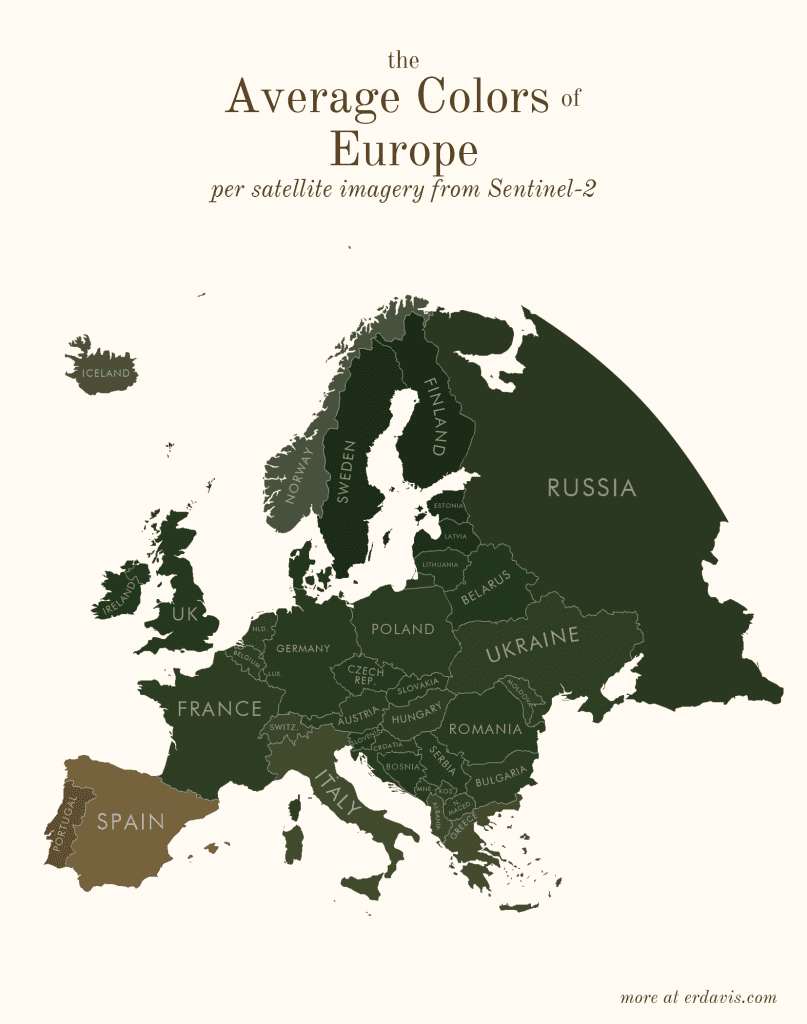
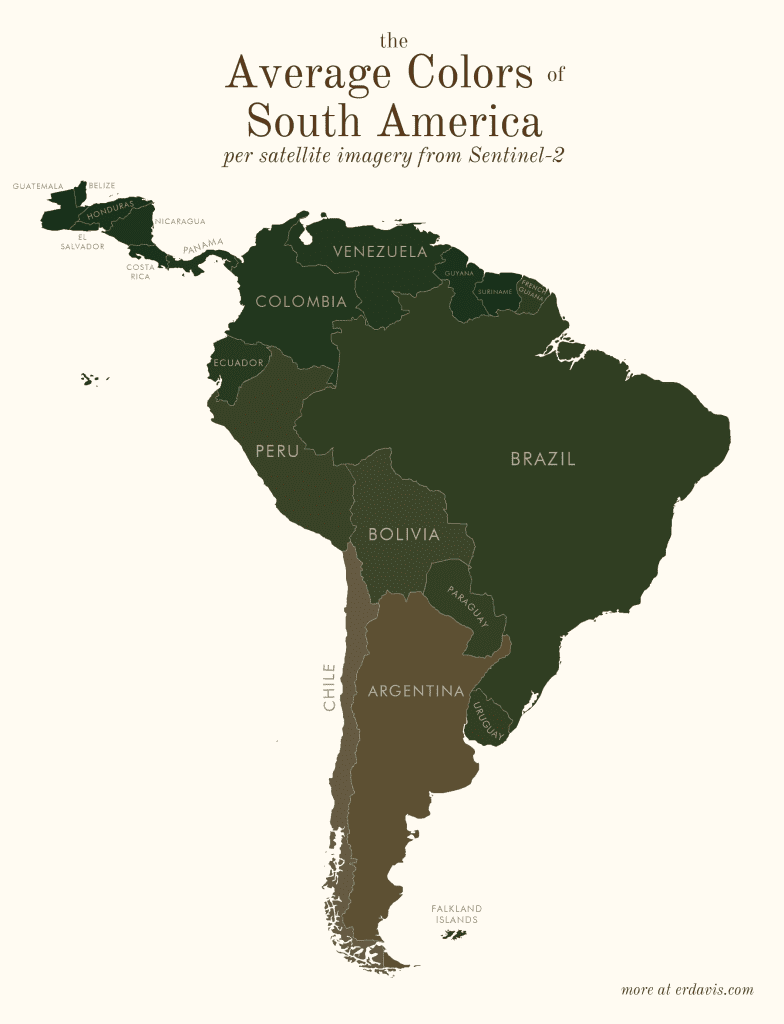
The rest of terrestrial Earth, however, is much more diverse, from deserts to dense rainforest — and this shows in the richer color palette as seen from space. Data scientist Erin Davis creatively illustrated this color palette in a series of maps showing the dominant color of various regions across the globe.

Davis used a dataset from the Copernicus Sentinel-2 mission, a constellation of two identical satellites in the same orbit, each equipped with a high-resolution multispectral imager capable of taking pictures of Earth’s land and vegetation in 13 different bands.

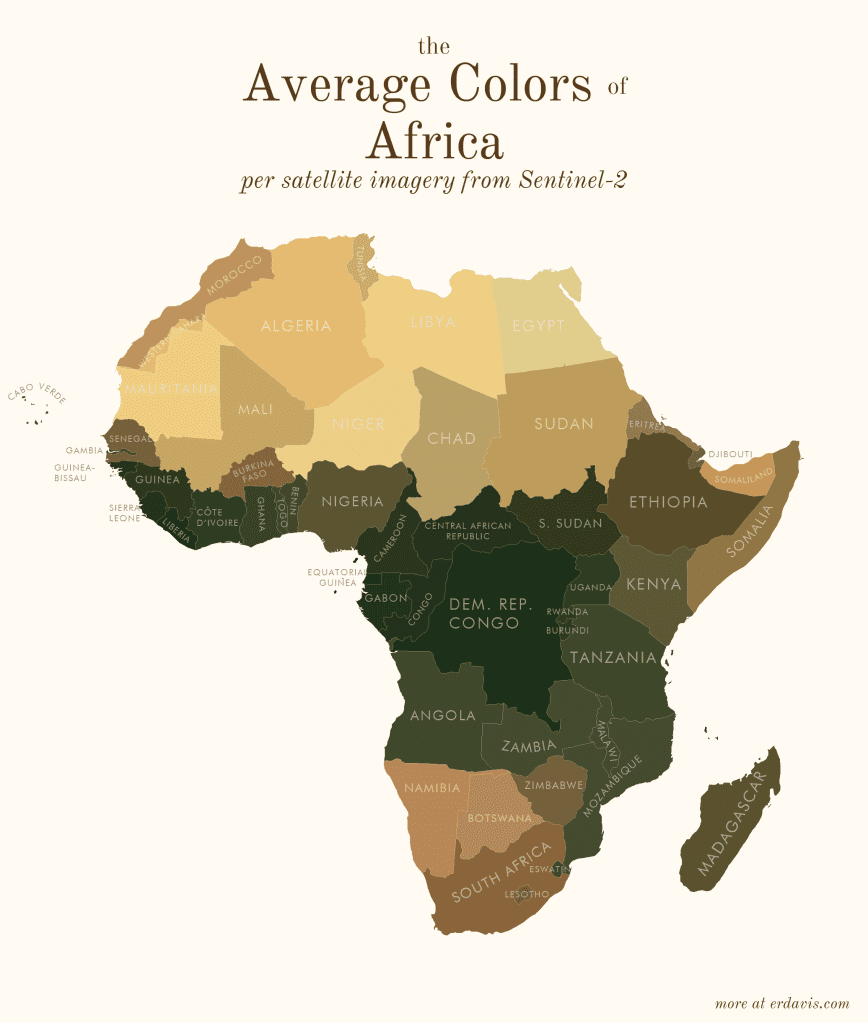
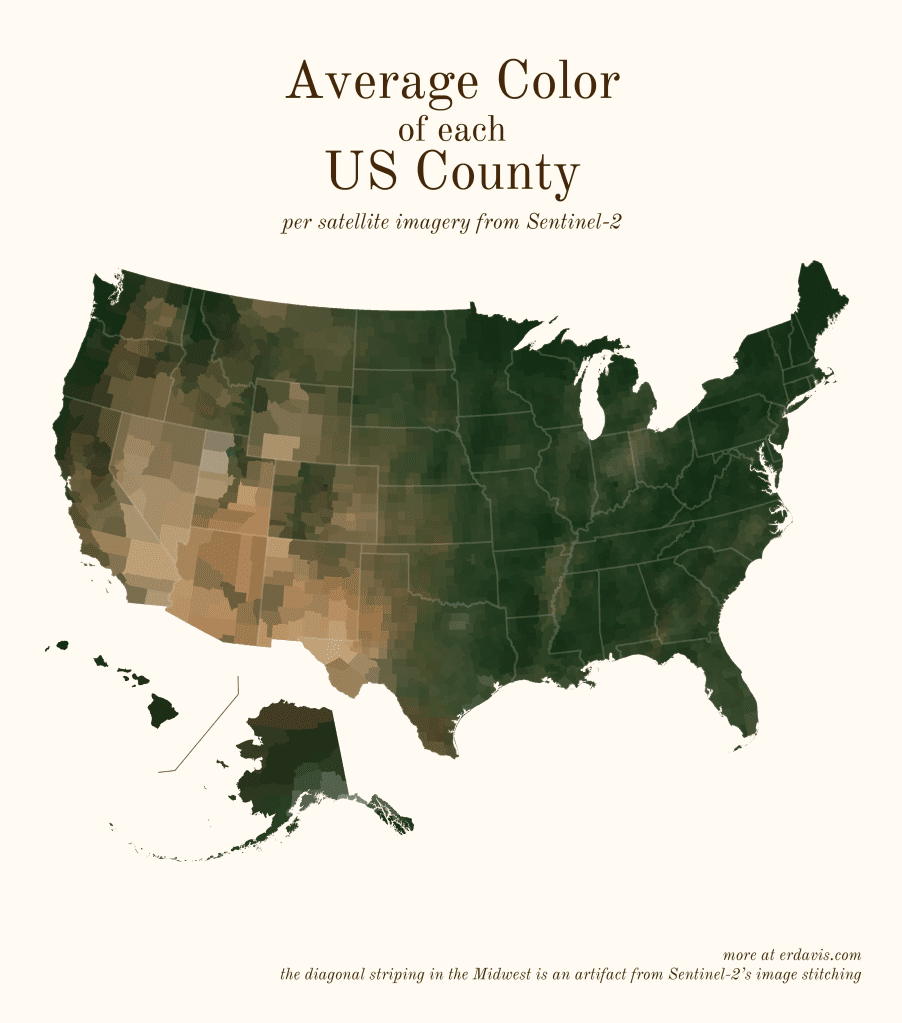
She then ran a script in the R programming language, which she coded herself, that assigned average colors to various areas, whether entire continents, countries, or states in the US.

In a short blog post on her website, Davis explained her process as follows:

  1. Wrote a script (in R) to find the bounding boxes of all the areas I was interested in
  2. In R, downloaded pictures of those areas from Sentinel-2
  3. In R, wrote a script that created a series of commands to:
    1. Georeference the downloaded image to create a geotiff
    2. Crop the geotiff to the borders of the area
    3. Re-project the geotiff to a sensible projection
  4. Ran that GDAL script
  5. In R, converted the geotiffs back to pngs, and found the average color of the png

In the same blog post, you can find all the R scripts she used for this project, which you can adapt for your own data visualizations. Contrary to popular belief, data isn’t boring. It can be creative and beautiful with the right mindset.

Tags: social media

ShareTweetShare
Tibi Puiu

Tibi Puiu

Tibi is a science journalist and co-founder of ZME Science. He writes mainly about emerging tech, physics, climate, and space. In his spare time, Tibi likes to make weird music on his computer and groom felines. He has a B.Sc in mechanical engineering and an M.Sc in renewable energy systems.

Related Posts

Science

Almost Half of Teens Say They’d Rather Grow Up Without the Internet

byMihai Andrei
3 weeks ago
Health

Using screens in bed increases insomnia risk by 59% — but social media isn’t the worst offender

byTibi Puiu
2 months ago
News

People Who Blocked Their Smartphone’s Internet for Two Weeks Report Big Mood Boost

byTibi Puiu
4 months ago
Future

The Inventor of the World Wide Web Calls Out Social Media’s Dark Side: “This toxicity comes from the algorithms”

byTibi Puiu
7 months ago

Recent news

Drinking Sugar May Be Far Worse for You Than Eating It, Scientists Say

June 11, 2025

A 30-Year-Old Study Says Croissants Are Absolutely Terrible. Here’s why

June 11, 2025

Spanish Galleon Sank With $17-Billion Worth of Treasure In Today’s Money. Now Confirmed As the World’s Richest Shipwreck

June 11, 2025
  • About
  • Advertise
  • Editorial Policy
  • Privacy Policy and Terms of Use
  • How we review products
  • Contact

© 2007-2025 ZME Science - Not exactly rocket science. All Rights Reserved.

No Result
View All Result
  • Science News
  • Environment
  • Health
  • Space
  • Future
  • Features
    • Natural Sciences
    • Physics
      • Matter and Energy
      • Quantum Mechanics
      • Thermodynamics
    • Chemistry
      • Periodic Table
      • Applied Chemistry
      • Materials
      • Physical Chemistry
    • Biology
      • Anatomy
      • Biochemistry
      • Ecology
      • Genetics
      • Microbiology
      • Plants and Fungi
    • Geology and Paleontology
      • Planet Earth
      • Earth Dynamics
      • Rocks and Minerals
      • Volcanoes
      • Dinosaurs
      • Fossils
    • Animals
      • Mammals
      • Birds
      • Fish
      • Amphibians
      • Reptiles
      • Invertebrates
      • Pets
      • Conservation
      • Animal facts
    • Climate and Weather
      • Climate change
      • Weather and atmosphere
    • Health
      • Drugs
      • Diseases and Conditions
      • Human Body
      • Mind and Brain
      • Food and Nutrition
      • Wellness
    • History and Humanities
      • Anthropology
      • Archaeology
      • History
      • Economics
      • People
      • Sociology
    • Space & Astronomy
      • The Solar System
      • Sun
      • The Moon
      • Planets
      • Asteroids, meteors & comets
      • Astronomy
      • Astrophysics
      • Cosmology
      • Exoplanets & Alien Life
      • Spaceflight and Exploration
    • Technology
      • Computer Science & IT
      • Engineering
      • Inventions
      • Sustainability
      • Renewable Energy
      • Green Living
    • Culture
    • Resources
  • Videos
  • Reviews
  • About Us
    • About
    • The Team
    • Advertise
    • Contribute
    • Editorial policy
    • Privacy Policy
    • Contact

© 2007-2025 ZME Science - Not exactly rocket science. All Rights Reserved.