
When doing science, you can never afford certainties. A skeptical outlook will always do you good but if this is the case how can scientists tell if their results are significant in the first place? Well, instead of relying on gut feeling, any researcher that’s worth his salt will let the data speak for itself. Namely, a result will be meaningful if it’s statistically significant. But in order for a statistical result to be significant for everyone involved, you also need a standard to measure things.
When referring to statistical significance, the unit of measurement of choice is the standard deviation. Typically denoted by the lowercase Greek letter sigma (σ), this term describes how much variability there is in a given set of data, around a mean, or average, and can be thought of as how “wide” the distribution of points or values is. Samples with a high standard deviation are considered to be more spread out, meaning it has more variability and the results are more interpretable. A low standard deviation, however, revolves more tightly around the mean.
Roll the dice
To understand how scientists use the standard deviation in their work, it helps to consider a familiar statistical example: the coin toss. The coin only has two sides, heads or tails, so the probability of getting one side of the other following a toss is 50 percent. If you flip a coin 100 times, though, chances are you won’t get 50 instances of heads and 50 of tails. Rather, you’ll likely get something like 49 vs 51. If you repeat this 100-coin-toss test another 100 times, you’ll get even more interesting results. Sometimes you’ll get something like 45 vs 55 and in a couple of extreme cases 20 vs 80.
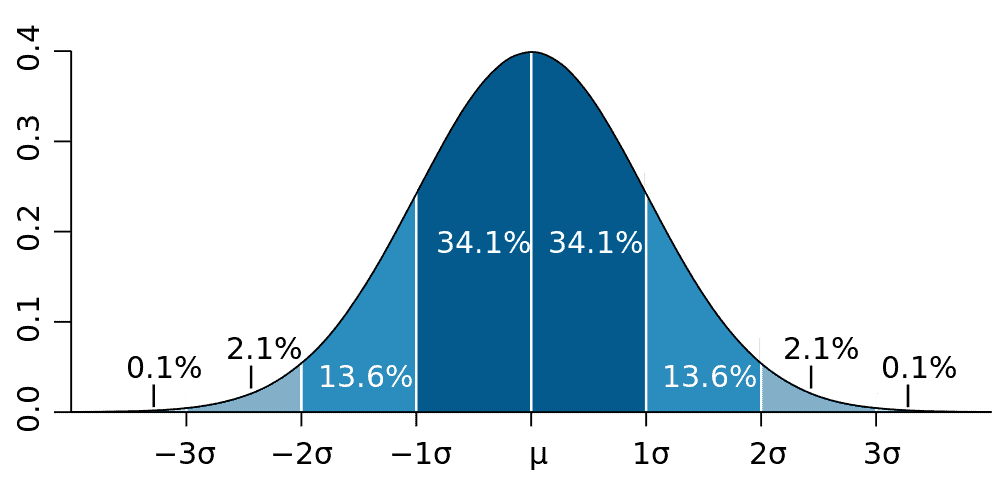
If you plot all of these coin-toss tests on a graph, you should typically see a bell-shaped curve with the highest point of the curve in the middle, tapering off on both sides. This is what you’d call a normal distribution, while the deviation is how far a given point is from the average.
One standard deviation or one-sigma, plotted either above or below the average value, includes 68 percent of all data points. Two-sigma includes 95 percent and three-sigma includes 99.7 percent. Higher sigma values mean that the discovery is less and less likely to be accidentally a mistake or ‘random chance’.
Here’s another way to look at it. The mean human IQ is 100. Data suggests 68 percent of the population are in what is called one standard deviation from the mean (one-sigma) and 27.2 percent of the population are two standard deviations from the mean, being either bright or rather intellectually challenged depending on the side of the bell curve they are on. About 2.1 percent of the population is 3 standard deviations from the mean (3-sigma) — these are brilliant people. Around 0.1% of the population is 4 standard deviations from the mean, the geniuses.
[panel style=”panel-info” title=”Worthy mention: the p-value” footer=””]
The standard deviation becomes an essential tool when testing the likelihood of a hypothesis. Typically, what scientists do is they construct two hypotheses, one where let’s say two phenomena A and B are not connected (the null hypothesis) and one where A and B are connected (the research hypothesis).
What scientists do is they first assume the null hypothesis is true, because that’s the most intellectually conservative thing to do, and then calculate the probability of obtaining data as extreme as the kind they’re observing. This calculation renders the p-value. A p-value close to zero signals that your null hypothesis is false, and typically that a difference is very likely to exist. Large p-values (p is expressed as a value between 0 and 1) imply that there is no detectable difference for the sample size used. A p-value of .05, for example, indicates that you would have only a 5% chance of drawing the sample being tested if the null hypothesis was actually true. Depending on the field, typically psychology and other social sciences, you’ll see papers use the p-value to illustrate statistical significance while maths and physics will employ sigma.
[/panel]
Don’t be so sure
Sometimes just two standard deviations above or below the average, which gives a 95 percent confidence level, is reasonable. Two-sigma is, in fact, standard practice among pollsters and the deviation is directly related to that “margin of sampling error” you’ll often hear reporters mention — in this case it’s 3 percent. If a poll found that 55 percent of the entire population favors candidate A, then 95 percent of the time, a second poll that samples the same number of (random) people will find candidate A is favored somewhere between 52 and 58 percent.
The table below summarizes various σ levels down to two decimal places.
| σ | Confidence that result is real |
|---|---|
| 1σ | 84.13% |
| 1.5 σ | 93.32% |
| 2 σ | 97.73% |
| 2.5 σ | 99.38% |
| 3 σ | 99.87% |
| 3.5 σ | 99.98% |
| > 4 σ | 100% (almost) |
For some fields of science, however, 2-sigma isn’t enough, nor 3 or 4-sigma for that matter. In particle physics, for instance, scientists work with million or even billions of data points, each corresponding to a high energy proton collision. In 2012, CERN researchers reported the discovery of the Higgs boson and press releases tossed the term 5-sigma around. Five-sigma corresponds to a p-value, or probability, of 3×10⁻⁷, or about 1 in 3.5 million. This is where you need to put your thinking caps on because 5-sigma doesn’t mean there’s a 1 in 3.5 million chance that the Higgs boson is real or not. Rather, it means that if the Higgs boson doesn’t exist (the null hypothesis) there’s only a 1 in 3.5 million chance the CERN data is at least as extreme as what they observed.
Sometimes 5-sigma isn’t enough to be ‘super sure’ of a result. Not even six sigma, which roughly translates to one chance in half a billion that a result is a random fluke. Case in point, in 2011 another experiment from CERN called OPERA found that nearly massless neutrinos travel faster than light. This claim, which bore 6-sigma confidence, was rightfully controversial because it directly violates Einstein’s principle of relativity which says the speed of light is constant to all observers and nothing can travel faster than it. Later, four independent experiments failed to come up with the same level of confidence and OPERA scientists think their original measurement can be written off as owing to a faulty element of the experiment’s fiber-optic timing system.
So bear in mind, just because a result falls inside an accepted interval for significance, that doesn’t necessarily make it truly significant. Context matters, especially if your results are breaking the laws of known physics.
Was this helpful?


