Quantcast
ZME Science
  • News
  • Environment
  • Health
  • Future
  • Space
  • Features
    Menu
    Natural Sciences
    Health
    History & Humanities
    Space & Astronomy
    Technology
    Culture
    Resources
    Natural Sciences

    Physics

    • Matter and Energy
    • Quantum Mechanics
    • Thermodynamics

    Chemistry

    • Periodic Table
    • Applied Chemistry
    • Materials
    • Physical Chemistry

    Biology

    • Anatomy
    • Biochemistry
    • Ecology
    • Genetics
    • Microbiology
    • Plants and Fungi

    Geology and Paleontology

    • Planet Earth
    • Earth Dynamics
    • Rocks and Minerals
    • Volcanoes
    • Dinosaurs
    • Fossils

    Animals

    • Mammals
    • Birds
    • Fish
    • Reptiles
    • Amphibians
    • Invertebrates
    • Pets
    • Conservation
    • Animals Facts

    Climate and Weather

    • Climate Change
    • Weather and Atmosphere

    Geography

    Mathematics

    Health
    • Drugs
    • Diseases and Conditions
    • Human Body
    • Mind and Brain
    • Food and Nutrition
    • Wellness
    History & Humanities
    • Anthropology
    • Archaeology
    • Economics
    • History
    • People
    • Sociology
    Space & Astronomy
    • The Solar System
    • The Sun
    • The Moon
    • Planets
    • Asteroids, Meteors and Comets
    • Astronomy
    • Astrophysics
    • Cosmology
    • Exoplanets and Alien Life
    • Spaceflight and Exploration
    Technology
    • Computer Science & IT
    • Engineering
    • Inventions
    • Sustainability
    • Renewable Energy
    • Green Living
    Culture
    • Culture and Society
    • Bizarre Stories
    • Lifestyle
    • Art and Music
    • Gaming
    • Books
    • Movies and Shows
    Resources
    • How To
    • Science Careers
    • Metascience
    • Fringe Science
    • Science Experiments
    • School and Study
    • Natural Sciences
    • Health
    • History and Humanities
    • Space & Astronomy
    • Culture
    • Technology
    • Resources
  • Reviews
  • More
    • Agriculture
    • Anthropology
    • Biology
    • Chemistry
    • Electronics
    • Geology
    • History
    • Mathematics
    • Nanotechnology
    • Economics
    • Paleontology
    • Physics
    • Psychology
    • Robotics
  • About Us
    • About
    • The Team
    • Advertise
    • Contribute
    • Privacy Policy
    • Contact
No Result
View All Result
ZME Science

No Result
View All Result
ZME Science

Home → Environment → Climate

CO2 concentrations quietly reached the highest daily values in recorded history

For the first time since its inauguration, the Mauna Loa Observatory reaches 421.21 ppm of CO2 concentration.

Paula Ferreira by Paula Ferreira
April 15, 2021
in Climate, News, World Problems

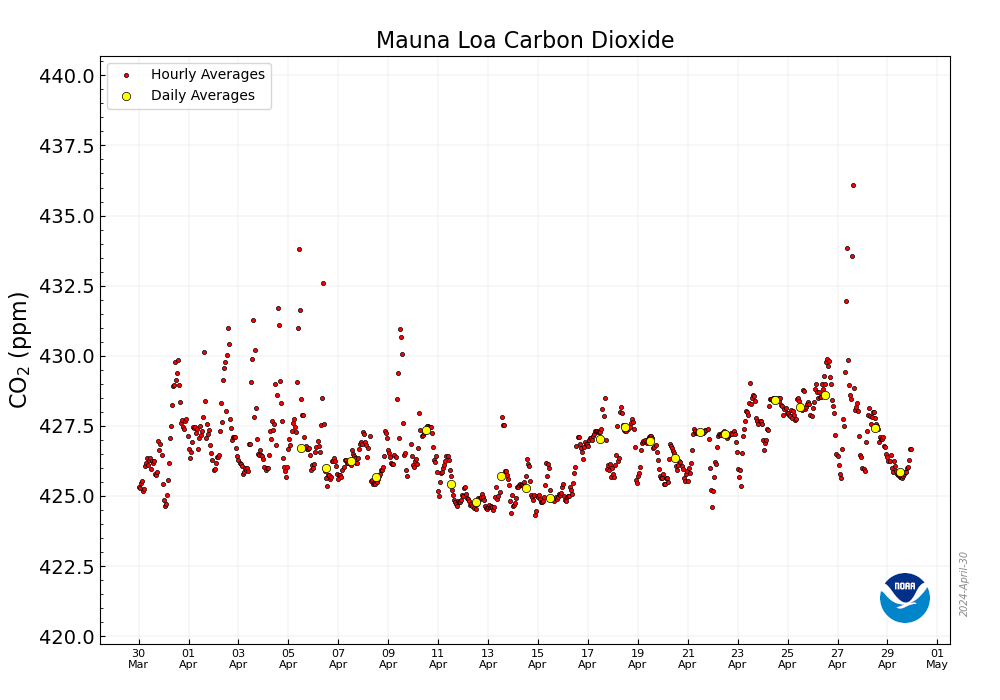
The Earth has sent us another warning that the climate crisis is here and we’d best do something about it. The highest CO2 level on record happened on April 3, the shocking observation reached 421.21 ppm. On April 2, the concentration was 416.97 ppm.

Hourly (red circles) and Daily (yellow circles) averaged CO2 values from Mauna Loa, Hawaii for the last 31 days. Credits: GML NOAA.

Why this matters

Mauna Loa Observatory is located on the Big Island of Hawaii and it has been in operation since 1950, the oldest place measuring CO2 concentrations still in action. It’s far from the continental landmass and big cities, and nearly 3,400 m above sea level. This means almost nothing contaminates the data, apart from the volcano spurious data which scientists can easily eliminate.

If this observatory planted in the middle of the Pacific Ocean, far from any perturbance, has detected the highest amount of CO2 levels without any interference from its volcano, and after a ‘decline’ of human activity which happened in 2020 — this means we are in trouble.

Keeling curve

It’s important to note that one or two extreme values don’t necessarily mean much on their own. There are always exceptions. But these large CO2 values are not exceptions — quite the contrary: they are part of a well-observed phenomenon of CO2 rising in the atmosphere. Don’t believe me? Have a look at this chart:

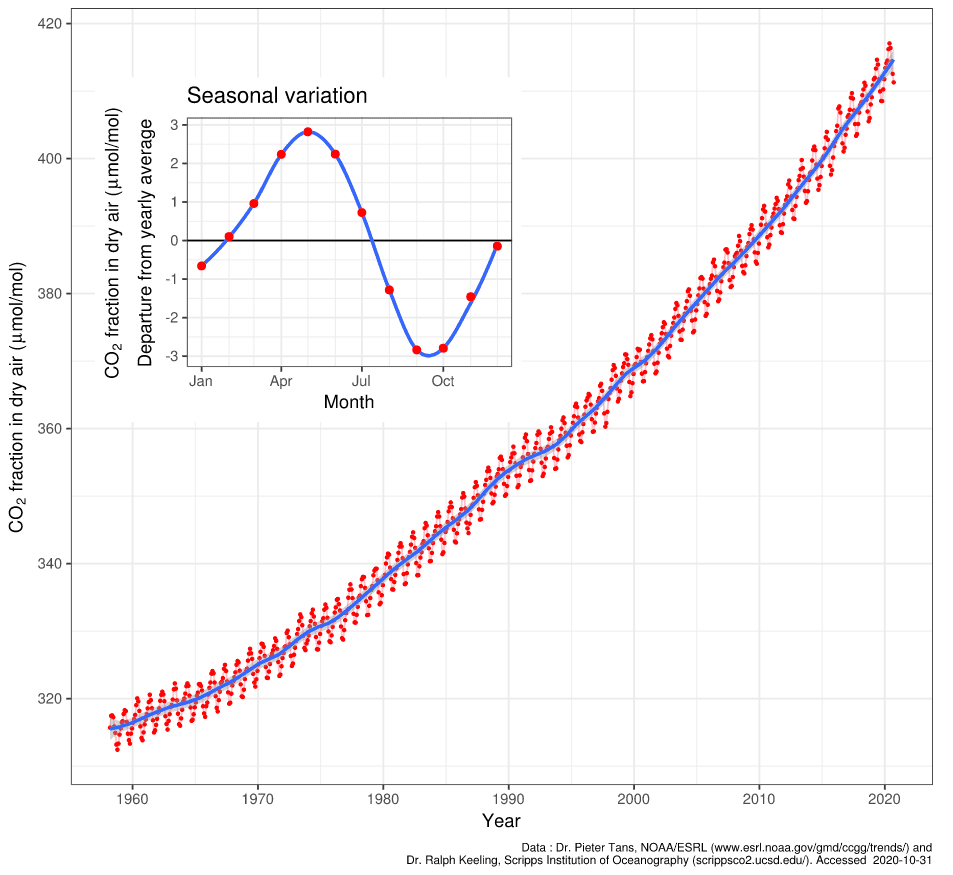
In 1976, a team led by Charles Keeling published the first analysis of the evolution of CO2 concentration from the Mauna Loa observatory. The curve later became known as the Keeling curve.

The graph shows the increase in carbon dioxide year by year, the recent plot shows how this is even more significant compared to the ’70s. Inside the increasing trend, you see annual oscillations, they are the result of a natural response in the climate. Leaves fall during Autumn in the Northern Hemisphere, so the vegetation is less successful in retaining the CO2 in the air.

CO2 effects

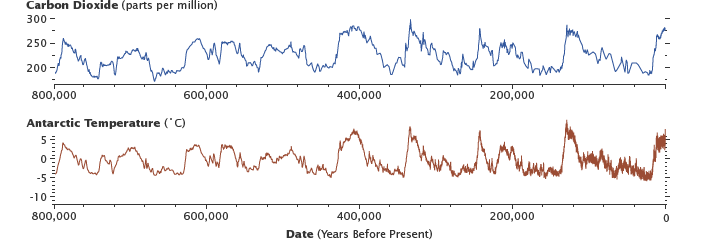
Carbon dioxide is what’s called a greenhouse gas: it ‘stores’ energy that then heats up the air.

If the carbon dioxide increases, the temperature of the atmosphere (and subsequently, the entire planet’s surface) increases. The graph below shows the correlation in the trend, how temperature and concentrations are tightly coupled. But that is a simplistic point of view, the Earth is a complex system, so add temperature response with the other greenhouse gases, other interactions, and feedbacks happening at the same time.

Levels of carbon dioxide in the atmosphere have corresponded closely with temperature over the past 800,000 years. Although the temperature changes were touched off by variations in Earth’s orbit, the increased global temperatures released CO2 into the atmosphere, which in turn warmed the Earth. Antarctic ice-core data show the long-term correlation until about 1900. (Graphs by Robert Simmon, using data from Lüthi et al., 2008, and Jouzel et al., 2007.)

It is a fact that the current record is one point of one single day in the curve, climatology requires years of observation. However, there is no doubt this a scary alert from the climate system, knowing the recent events: one of the hottest years, biomass less significant than human-made mass, shocking Hurricane season, deforestation records, fires records, all this in a small period of time.

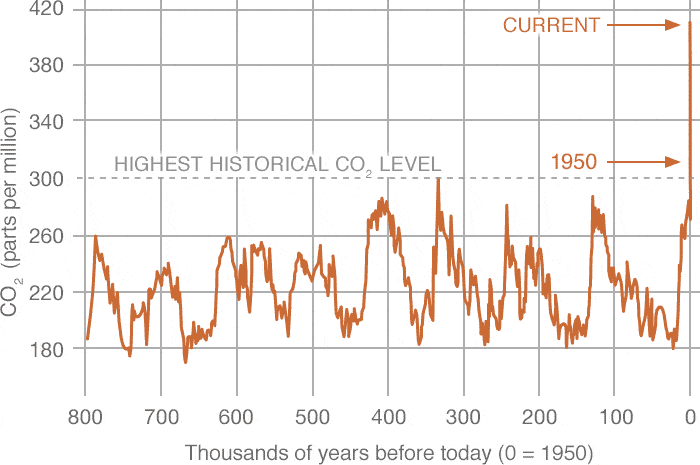
Ultimately, it’s also important to put thigns into a historic context. Looking at the charts above, things seem normal. But things don’t seem normal at all when we include the past few centuries.

The fact that the main cause of this abrupt rise in the concentrations is obviously human, it was obvious for Keeling and Hansen back then, it seems ridiculous to ignore it now.

Was this helpful?
Thanks for your feedback!
Related posts:
  1. Peak oil – reached. Peak water – reached. Next on the list? Peak soil
  2. Average atmospheric CO2 levels last month were the highest we’ve ever recorded, ever
  3. Highest Silicon Solar Cell Efficiency Ever Reached
  4. Greenhouse gas concentrations reach new record
  5. May 2019 sets new record for highest average atmospheric CO2 levels in history

ADVERTISEMENT
  • News
  • Environment
  • Health
  • Future
  • Space
  • Features
  • Reviews
  • More
  • About Us

© 2007-2021 ZME Science - Not exactly rocket science. All Rights Reserved.

No Result
View All Result
  • News
  • Environment
  • Health
  • Future
  • Space
  • Features
    • Natural Sciences
    • Health
    • History and Humanities
    • Space & Astronomy
    • Culture
    • Technology
    • Resources
  • Reviews
  • More
    • Agriculture
    • Anthropology
    • Biology
    • Chemistry
    • Electronics
    • Geology
    • History
    • Mathematics
    • Nanotechnology
    • Economics
    • Paleontology
    • Physics
    • Psychology
    • Robotics
  • About Us
    • About
    • The Team
    • Advertise
    • Contribute
    • Privacy Policy
    • Contact

© 2007-2021 ZME Science - Not exactly rocket science. All Rights Reserved.

Don’t you want to get smarter every day?

YES, sign me up!

Over 35,000 subscribers can’t be wrong. Don’t worry, we never spam. By signing up you agree to our privacy policy.

✕
ZME Science News

FREE
VIEW