Satellite data shows New York City is still sinking -- and so are many big US cities
No, it’s not because of the recent flooding.
Big parts of New York City are sinking at different rates. This was first reported in 2023, when researchers theorized that the weight of skyscrapers may have a role to play. Now, a series of studies is showing that NYC continues its sink at a remarkably steady rate
They found that New York’s sinking is due to factors ranging from long-lost glaciers to land-use practices. While the changes may seem small at less than 2 millimeters per year, they can alter local flood risk related to sea level rise, and over the course of several years, they can do some serious damage.
To map these subtle shifts in the landscape, researchers employed a powerful satellite-based method called interferometric synthetic aperture radar (InSAR). This is a bit like a space-based “spot the difference” game. A satellite bounces radar signals off the ground to create a detailed image. By later taking another image from the same position and comparing the two, scientists can detect minuscule changes in the distance the radar signal traveled. These differences create a unique interference pattern, called an interferogram, which serves as a high-resolution map revealing ground motion—either sinking or uplift—down to millimeter-level precision.
A new generation of Earth-monitoring satellites is helping us get a better understanding of how various regions on Earth are shifting.
The eye in the sky
A big part of the motion observed happened in places where prior changes have made the ground looser and more compressible. In particular, projects such as landfills or land reclamation make the ground more susceptible. So when you come and later build over such soils (particularly heavy buildings like skyscraper), you’re at a higher risk of soil compression and sinking.
However, some of this sinking was also caused by natural processes that date back thousands of years to the most recent ice age.
About 24,000 years ago, a vast ice sheet extended over most of New England, with an ice sheet of over a mile in height enveloping present-day Albany in upstate New York. Since then, the Earth’s surface has been gradually readjustingNew York City, on land that was elevated outside the edge of the ice sheet, is presently undergoing subsidence because of this.
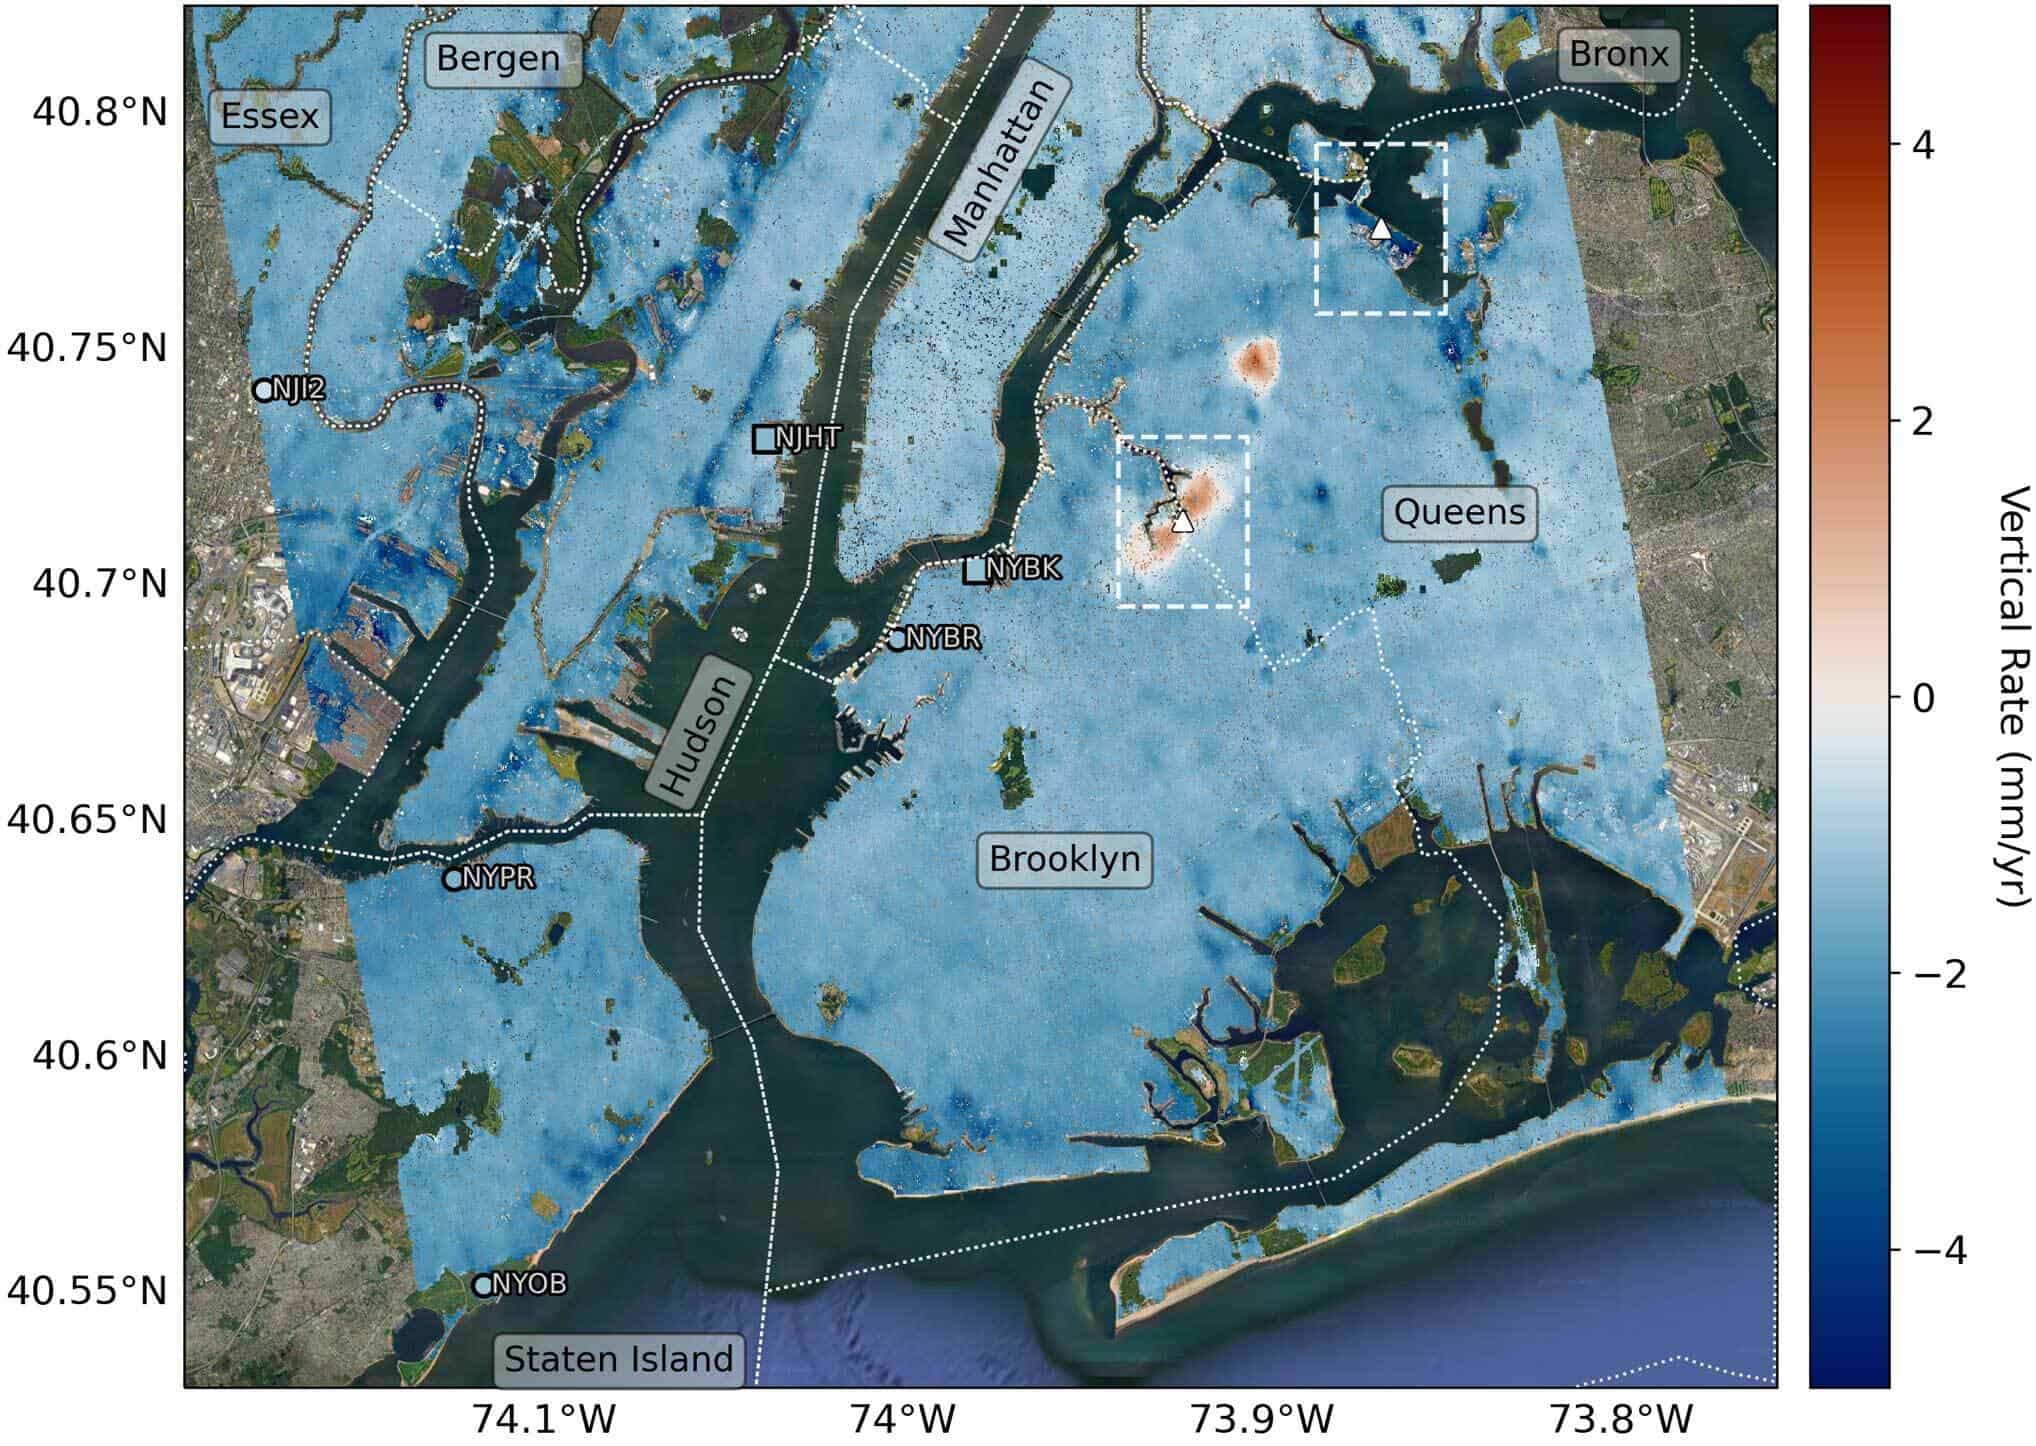
The researchers found that on average the metropolitan area has subsided by about 1.6 millimeters (0.06 inches) per year. This is similar to how much toenails grow by each month. Using the radars on the ESA Sentinel-1 satellites, they mapped the motion in detail and pinpointed the neighborhoods and landmarks that are subsiding faster than average.
“We’ve produced such a detailed map of vertical land motion in the New York City area that there are features popping out that haven’t been noticed before,” lead author Brett Buzzanga said in a news release. Tracking elevation changes and sea level changes is very important for flood mapping amid Earth’s changing climate, pushing oceans higher.
The sinking hotspots
The researchers identified two major hotspots of subsidence. The first one is the runway 13/31 at LaGuardia airport, where the land is sinking faster than average (3.7 mm). The airport is now going through a renovation to partly alleviate flooding from the rising waters of the Atlantic Ocean.
The second hotspot is the Arthur Ashe Stadium, where the US Open is held every year. The stadium is sinking at a rate of 4.6 mm per year and in fact, required construction of a lightweight roof to reduce its heaviness. Both the runway and the stadium were originally built atop landfills, which explains the higher-than-average rates.
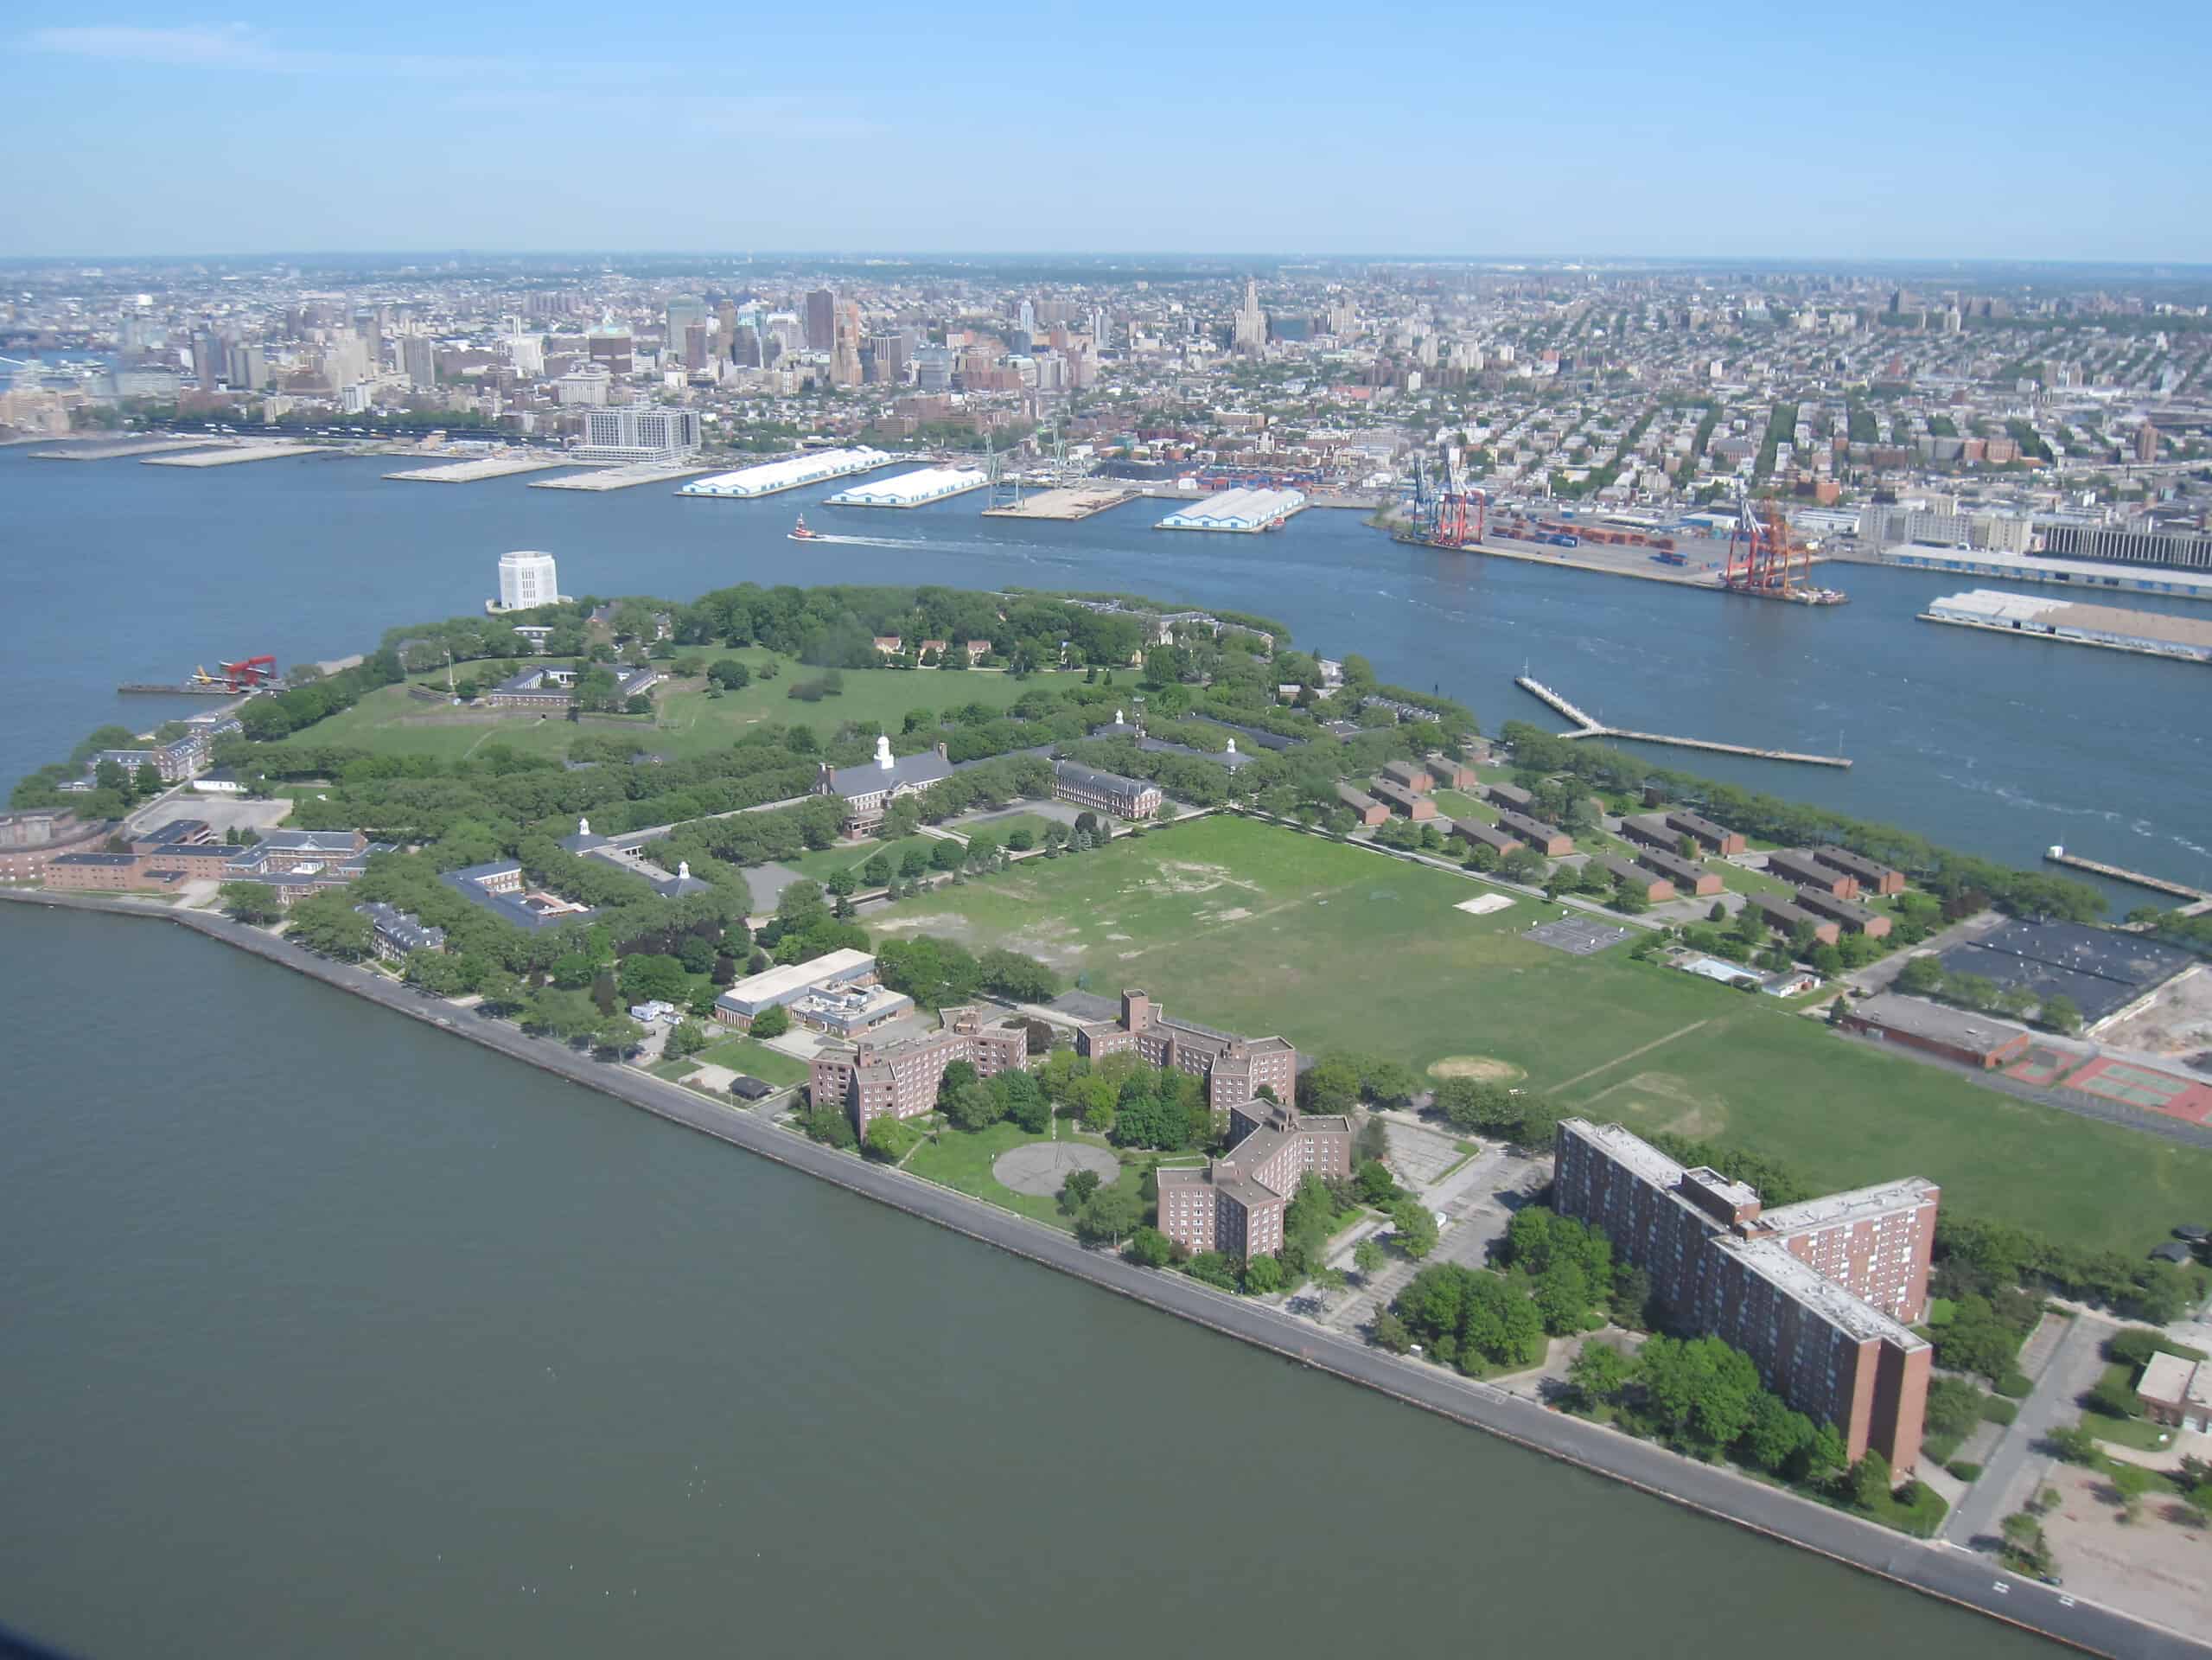
Other hotspots include the southern part of Governors Island, which was built on 3.5 million cubic meters of rock and dirt from early 20th-century subway excavations, as well as sites close to the ocean in Coney Island in Brooklyn. High levels of sinking were also reported below Route 440 and Interstate 78 in New Jersey and Rikers Island.
But not all of New York City is sinking.
The researchers were also surprised to find some places in New York where the land is actually rising. In East Williamsburg, Brooklyn, the land is moving up by about 1.6 mm per year. Meanwhile, in Woodside, Queens, the land rose 6.9 mm per year between 2016 and 2019 before finally stabilizing.
For close to two centuries, water levels in the New York City area have been increasing at an approximate rate of 0.11 inches annually (0.28 cm). The city recently made the news because of flash flooding, which led to a state of emergency. Up to 20 cm (around 7.9 in) of rain fell in some parts of the city, with the subway, streets and highways flooding very fast.
The researchers believe that many cities currently investing in coastal defenses and infrastructure to respond to sea level rise, such as NYC, can benefit from high-resolution estimates of land motion, as seen in this study. That’s why they will continue looking at surface displacement across North America, using new data.
The problem continues in 2025

The groundbreaking 2023 study was just the beginning. In fact, the subsidence turned out to be more prevalent than initially thought. A study published in Nature Cities in May 2025 has shown that subsidence is a widespread hazard threatening dozens of major U.S. cities. Using satellite data from 2015 to 2021, a team led by researchers from Columbia University and Virginia Tech created high-resolution maps of sinking land for the 28 most populous metropolises in the country
The research found that in every city studied, at least 20% of the urban area is sinking. For New York, the study revealed that about 98% of the city’s land area is affected by subsidence. The area-weighted average subsidence rate for New York was found to be greater than 2 mm per year. One of the city’s key infrastructure sites, LaGuardia Airport, was again highlighted as having localized zones sinking faster than 5 mm per year. New York, wasn’t even the worse affected city, with places like Houston having way worse subsidence.
Turns out, it’s not just the skyscrapers. In fact, the biggest impact seems to be coming from water extraction.
While natural processes like Glacial Isostatic Adjustment (GIA) are a dominant factor in New York’s sinking, the study emphasizes that human activities—primarily groundwater withdrawal—are responsible for most of the subsidence observed nationally
By analyzing groundwater levels, researchers found a strong link between changes in confined aquifers and corresponding land subsidence or uplift. In New York, the data showed a higher sensitivity to groundwater-level changes. The more intense groundwater use is in a region, the more likely the chance of significant subsidence (over 1 mm).
The study assessed the risk to infrastructure, concluding that while most buildings face low to medium risk, over 29,000 buildings across the 28 cities are in high and very high-risk zones for damage. This new, comprehensive picture underscores that the sinking of America’s cities is a slow-moving but critical environmental challenge requiring immediate attention and policy changes for urban planning and resource management.
The study was published in the journal Science.
This article was originally published in October 2023 and has been edited to include more recent research.