Stanford designed software to spot every solar panel in the US (there's a lot of them)
America's getting sun.
A new open-access tool developed at Stanford University reveals that, in certain U.S. states, solar panels now account over 10% of total energy generation.
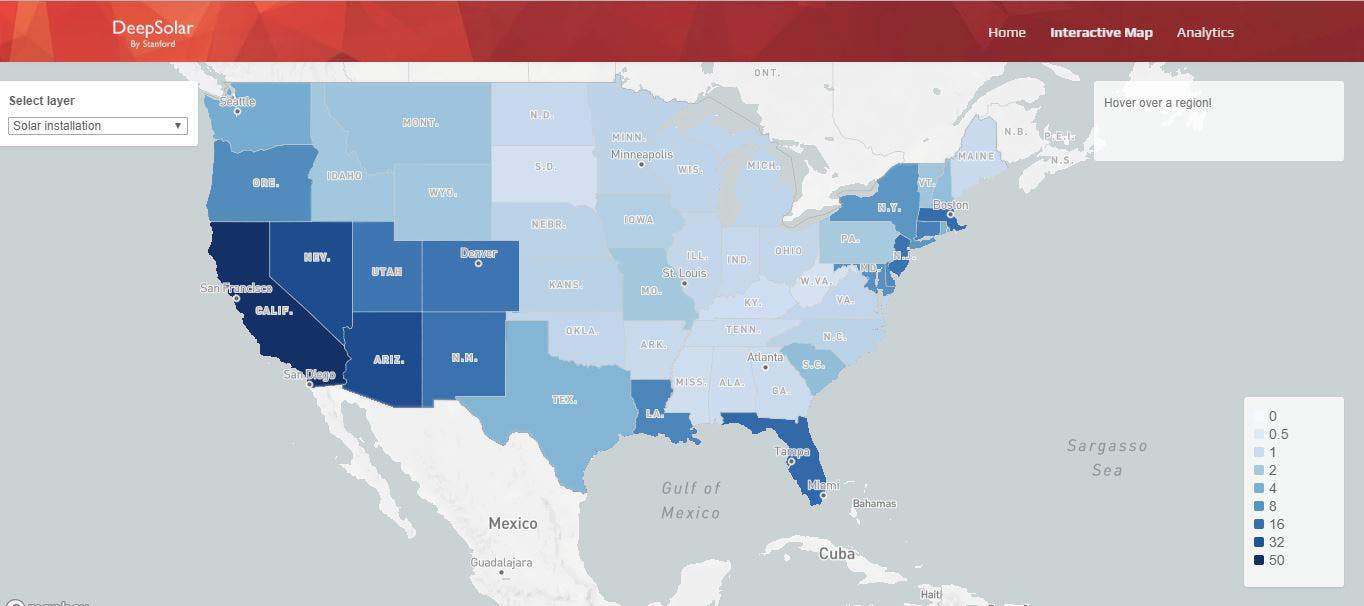
The interactive map of the United States on the DeepSolar website.
Image credits DeepSolar / Stanford University
Policy-makers, utility companies, researchers, and engineers currently have a hard time estimating just how many solar panels installed throughout the country. Stanford University researchers have come to their aid, however, with a new algorithm that makes it easier than ever before to quantify them and analyze development. The tool (accompanied by an open-access website) draws on high-resolution satellite data and automated image analysis.
Sunnyside up
“With these methods, we can not only maintain and update a high-fidelity database of solar installations, but also correlate them at the census-tract level with the amount of incoming solar radiation as well as non-physical factors such as household income and education level,” says co-senior author Arun Majumdar, a mechanical engineering professor at Stanford and co-Director of the Precourt Institute for Energy.
The tool, dubbed DeepSolar, offers unprecedented insight into the trends that drive solar power adoption by society at large, the team says. The algorithm works by analyzing high-resolution images across the U.S., looking for solar panels. When it finds a match, the program records the location and calculates its size.
In stark contrast to its predecessors, DeepSolar isn’t painfully slow. “Previous algorithms were so slow that they would have needed at least a year of computational time” to identify most of the solar panels in the U.S., says co-senior author Ram Rajagopal, a civil engineering professor at Stanford. Meanwhile, DeepSolar only needs a “fraction” of that time.
The team reports using DeepSolar to locate roughly 1.47 million individual solar installations across the country. These included rooftop panels, solar farms, and utility-scale installations. The software should help optimize solar development at the aggregate level, the team explains, especially since decentralization of solar power made it hard to keep track of all the panels being installed.

DeepSolar interactive map showing solar panel distribution by county in the region surrounding Chicago.
Image credits DeepSolar / Stanford University.
One area the team hopes to make an immediate impact with DeepSolar is in the U.S. power grid. The tool, they say, could be used to better integrate solar into the grid by accounting for daily and seasonal fluctuations in incoming sunlight.
“Now that we know where the solar panels are, or are likely to be in the future, we can feed that information into questions of modeling the electricity system and predicting where storage units and substations should go,” says Majumdar.
DeepSolar could also help in pinpointing new areas for solar deployment. The team used the program to establish correlations between solar installation density and variables such as population density or household income — which, when pooled together, allowed them to create a model predicting which areas are most likely to adopt solar in the future.
“Utilities, companies that install solar panels, even community planners that are thinking about sustainability, they all can benefit from this high-resolution spatial data and a website where they can explore and analyze the different trends involved,” Rajagopal says.
The team plans to expand the DeepSolar database to include solar installations in other countries with suitably high-resolution satellite images and to improve its ability to estimate energy output based on characteristics such as the angle of incoming light.
The paper “DeepSolar: A Machine Learning Framework to Efficiently Construct Solar Deployment Database in the United States” has been published in the journal Joule.


