Quantcast
ZME Science
  • News
  • Environment
  • Health
  • Future
  • Space
  • Features
  • ZME & more
    • About
    • The Team
    • Advertise
    • Contribute
    • Our stance on climate change
    • Privacy Policy
    • Contact
No Result
View All Result
ZME Science

No Result
View All Result
ZME Science
Home Other Feature Post

Australia plotted by every mapped stream and river… all 1.3 million of them

by Mihai Andrei
April 21, 2016
in Feature Post
A A

They say Australia is the Dry Continent, but you wouldn’t guess that based on this image:

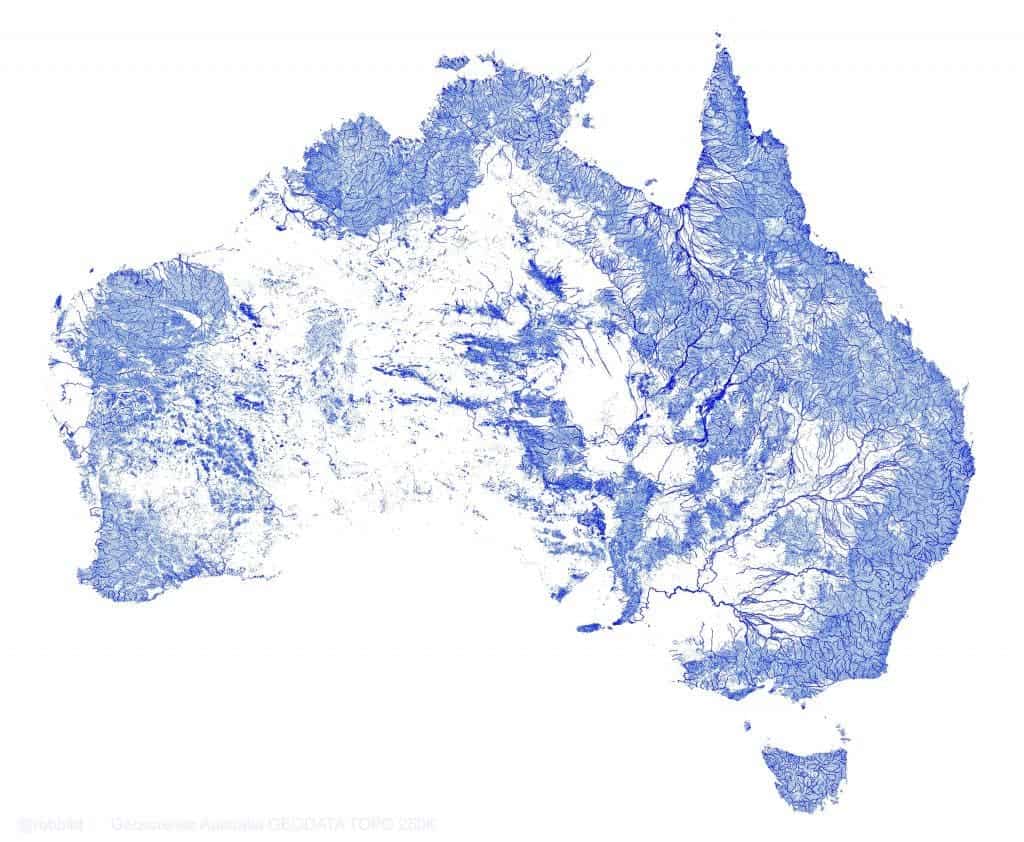
The image was created with QGIS using data for 1.3 million streams from Geoscience Australia GEODATA TOPO 250K vector datasets [GitHub code]. This is North-west Queensland:

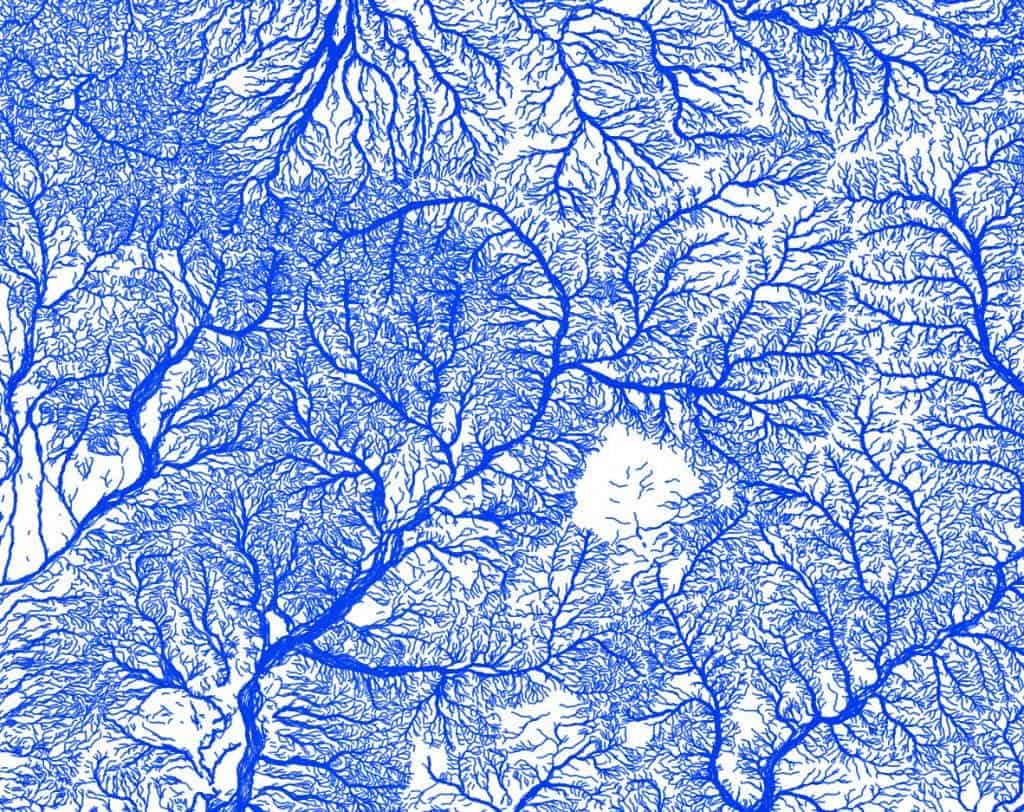
… and the North-east Murray-Darling Basin:


But there’s a catch: not all these rivers are permanent ones

“Many arid-zone rivers and streams in these maps are highly ephemeral, and may only flow once every few years or even decades. Streams are weighted by both ephemerality (perennial or non-perennial) and hierarchy (minor or major), with the highest weighting for major perennial rivers (i.e. Murray River),” the agency writes.

The map without the ephemeral rivers does indeed look much more barren, and I’m almost wondering if there’s something missing from this map.


Tags: australiariversremote sensing

ADVERTISEMENT
ADVERTISEMENT
  • News
  • Environment
  • Health
  • Future
  • Space
  • Features
  • ZME & more

© 2007-2021 ZME Science - Not exactly rocket science. All Rights Reserved.

No Result
View All Result
  • News
  • Environment
  • Health
  • Future
  • Space
  • Features
  • ZME & more
    • About
    • The Team
    • Advertise
    • Contribute
    • Our stance on climate change
    • Privacy Policy
    • Contact

© 2007-2021 ZME Science - Not exactly rocket science. All Rights Reserved.