Corrected satellite data shows 2.4 times faster warming than previously indicated
It also debunks one of climate deniers most cited argument.
New findings could throw (another) huge wrench in the workings of climate denier rhetoric. After correcting for an error in satellite data acquisition, scientists report not only that global warming taking place in the lower atmosphere — but that it’s way worse than we thought.

Beep beep.
Image via Pixabay.
A big Achilles Heel for people who actually base their opinions on facts and real information (go team!) is that we’re swayed by facts and information. So, naturally, we were quite bummed and more than a little perplexed when the folks over in the climate denier corner (booo) first threw satellite data on the table: it seemed to indicate that the Earth’s lower atmosphere wasn’t warming as quickly as we thought. This was especially strange since it was the one piece that didn’t really fit in with any other data — all of which pointed to rising temperatures caused by human activity.
But now, we know why it didn’t fit in: it was wrong. A new paper explains why this happened and describes a method to correct for the errors, showing that, in fact, warming is way faster than we’ve believed.
Bad timing
Satellites don’t measure ground temperature directly — however, atmospheric temperature readings can be used to infer surface and sea temperatures, and a warmer troposphere (the lowest layer of the atmosphere, where weather takes place) is consistent with what climate models show would happen as greenhouse gas levels increase in the atmosphere.
The faulty data was caused by satellites’ tendency to gradually inch nearer to Earth as they’re slowed down by friction with the gasses in the upper atmosphere (orbit decay). These sats are programmed to re-record and compare temperature data at various points at the same time of day as they circle back again, and thus spot any difference in temperature — in time, this data can be used to find a general trend, be it cooling, warming, or a constant trend-line.
However, as they’re calibrated to record data based on a constant orbit, even slight changes to orbit have a significant effect on the figures they measure. Slight alterations may not impact the data very much, but for some satellites, it can make a huge difference — they might fly over spot they’re programmed to record at 2 pm as late as 6 pm, even 8 pm, with a massive effect on temperature readings.
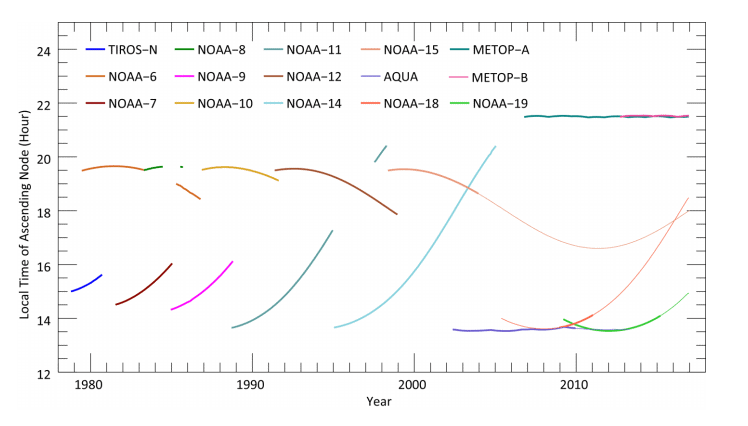
Equator crossing times for each of the satellites used in this study. Thinner lines indicate portions of mission that were not used for the study.
Image credits Mears et al., 2017.
Using information from the satellites, Dr Carl Mears and Frank Wentz of Remote Sensing Systems, a California-based research company, developed a way to correct for changes in data recording time. Correcting for satellite data is, in fact, a pretty common occurrence. We’ve only had the things a short while now, we’ve only been using them to measure temperature since the ’70s, and the first data sets were put together in the ’90s — so researchers have had to fix and correct for various teething problems while they learn how to use the things properly. This time the team had to make corrections:
“[…] primarily due to the changes in the adjustment for drifting local measurement time. The new dataset shows more warming than most similar datasets constructed from satellites or radiosonde [meteorological balloon] data,” the paper explains.
They used various approaches such as combining readings from different satellites which recorded the same spot both on mornings and evenings, using climate models to account for atmospheric temperature changes during the day, and including data from surface or weather balloon readings and other instruments to verify their data.
The corrected data set doesn’t paint a cool picture at all.
The results varied based on the methods the team used to correct initial data and the time of day when it was recorded, with temperature trends between 1979-2016 ranging from +0.13 C°/decade to +0.22 C°/decade. The duo says that the most ‘reasonable’ set of parameters was chosen, with a final temperature trend of +0.17 C°/decade. That’s over one-third (36%) faster than what previous satellite readings indicated in the 1979-1998 interval, and nearly 2.4 times (140%) faster for the 1998-2016 interval.
Overly under-estimated
A worrying implication of the new data set is that we may have underestimated how quickly the lower troposphere is warming from ground-level measurements alone — which means that climate, on the whole, may be warming up much faster than we’ve believed. Talking with Carbon Brief about the findings, data scientist Dr Zeke Hausfather (who wasn’t part of the study) said that “the new data actually shows more warming than has been observed on the surface, though still slightly less than predicted by most climate models.”
“Since the temperature changes since 1979 are on the order of 0.6C or so, it is relatively easy for bias, due to changing observation times, to swamp the underlying climate signal.”
All in all, ground measurements are way more reliable than satellite data since there are a lot more measurements take at ground level to compare between and exclude errors. In comparison, there are only a few satellites which can measure temperatures in a spot at any one time — a total of 15 temperature-reading satellites have been launched since 1979, and only about 2 or so are on active measuring duty at any one time. So errors such as the one this paper addresses can slip through quite easily.
But that also shows us we’re moving in the right direction. Correlating satellite data more closely with surface trends (which we know are reliable) only helps to increase confidence in the former.
The paper “A satellite-derived lower tropospheric atmospheric temperature dataset using an optimized adjustment for diurnal effects” has been published in the journal AMS.


